
Trever Christian and John Schwalbach, Partners
March 5, 2024
Share This:
Key Observations
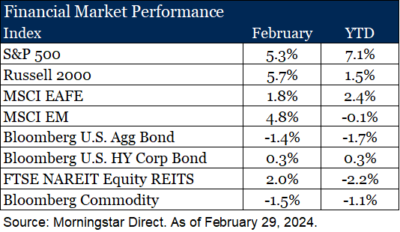
- Most risk assets advanced in February as optimism remains that the no-show recession of 2023 continues to fade further into the rear-view mirror. As a result, fixed income investors have also tempered the expectations around rate cuts and longer duration assets underperformed.
- For the first time in 34 years the Japanese index, Nikkei 225, hit a new all-time high. The nearly 3.5-decade comeback is instructive of how to think about risk and valuations.
- The Russia/Ukraine conflict entered its third year, and with hindsight, demonstrates two important macro trends of a multi-polar world and some newfound resiliency for Europe as it has waned off its reliance of Russian natural gas.
Market Recap
Stocks advance in February with indexes like the S&P 500 and the NASDAQ hitting new highs. While a new high for an index is not a new thing, in fact it happens quite regularly and often without material consequence, there was a recent new high that is worth reflecting on. The Japanese equity index (the Nikkei 225) hit a new all-time high for the first time since 1989! We’ll do the math for you: that’s 34 years. For some pop culture points of reference, the last time the Nikkei was at these levels Poison’s Every Rose Has Its Thorn was the number one song in the U.S., Nintendo launched the Gameboy and the Berlin Wall fell marking the end of the cold war. Why it took this long to come back is an import investment lesson. In a word, valuation.
Valuation Matters
Japan was the premiant stock market in the late 1980’s. They were know for leading in robotics, gaming, and banking. At the time the top five largest companies in the world by market cap were, you guessed it, all Japanese and the Nikkei quickly raced toward 40,000 with many companies near their peak equity valuation based on this investor exuberance. That’s when financial physics (that is rationale economics, just like gravity, applies to all investments) set in. It is hard for a company trading at lofty valuations to sustain those levels of success and as a result investors sought opportunity elsewhere and Japanese stocks fell precipitously. While Japan’s run up and come back were both extreme, they serve as a valuable lesson all these years later. What you pay for an investment matters. All else equal, it is easier to outrun modest expectations than it is lofty ones.
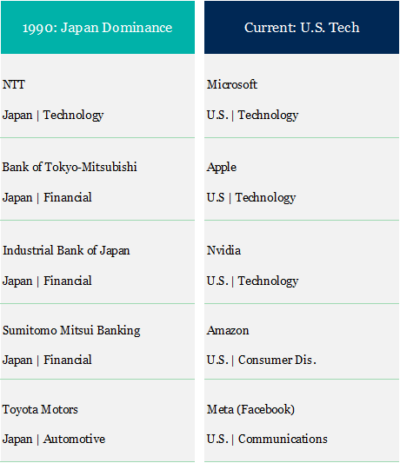
As we look to markets today, there are some similarities and some key differences that we can apply. First, the U.S. today like 1980’s Japan exhibits similar levels of stock market preeminence. Today, the top five stocks globally are all based in the U.S., all of which are technology or technology related stocks, and whose collective market cap is larger than the bottom
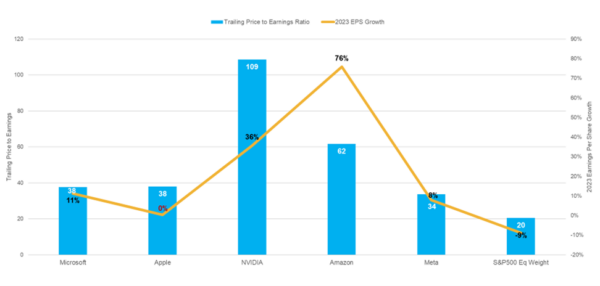
383 companies in the S&P 500 combined1. This level of dominance naturally begs the questions, “does gravity still apply?”. Our answer is a resounding “yes”, but at periods of time certain stocks can feel weightless. As you can see in the following exhibit, the current top five stocks in the U.S. trade at full valuations but have arrived there deservedly so. The equal weight S&P 500 index EPS contracted at -9% in 2023. The top five U.S. socks grew EPS on average by 52%. Full valuations begin to make more sense in that context. I.e. gravity still applies. Yet the trillion-dollar (pardon the market cap pun) question remains, how sustainable are these levels of returns and success? In our next writing we’ll explore another natural world analogy to describe markets, which is seasonality. History has taught us about the seasons of companies outearning their economic or societal benefit and the consequences to price as a result.
Russian Hindsight
However, before we adjourn and because it is a leap year with one more day of writing, we’ll add another decidedly more recent historical milestone to mark in February. As of February 24, Russia’s invasion of Ukraine has now entered its third year. What was originally deemed a forgone conclusion of military victory and devastating economic sanctions for the Kremlin has turned out to be anything but. Such events have a mercurial way of teaching us humility. However, now with hindsight we can see a number of important macro trends.
First, Russia’s economy was bailed out from the lifelines it threw to the east, namely to China and India. The walls that continue to build in this multi-polar world may continue to instruct policy, geopolitical tension and inflation as near- or friend-shoring continues and the flow of global goods is impeded. This reconciles well with our 2024 theme of “the messy middle” in which it is our expectation that inflation will remain subdued, but will have fits-and-starts feeding both investor anxiety and Fed watcher trepidation.
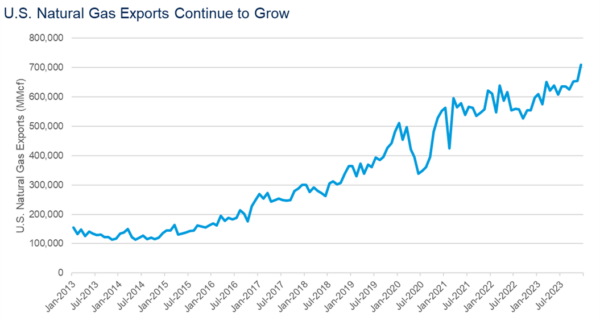
Second, just as Russia avoided the cost of economic decline, so did Europe. With time as an ally, the U.S has emerged as the EU’s largest natural gas supplier in 2023. U.S. natural gas exports are now at all-time high and have increased 30% since Russia invaded Ukraine. Much of that incremental grow headed to Europe. This has created both opportunity here in the U.S. and greater stability for Europe.
Outlook
Our investment themes that we outlined heading into 2024 remain in the wake of upward market performance in February: the “messy middle” inflation range of 2-5%, preparing not predicting recession, and concentrated consequences. We believe a thoughtful portfolio construction framework rooted in valuation helps avoid some of the extremes we noted above and keep our sights on our long-term objectives.
- Source: FactSet as of March 1, 2024
Disclosures & Definitions
Comparisons to any indices referenced herein are for illustrative purposes only and are not meant to imply that actual returns or volatility will be similar to the indices. Indices cannot be invested in directly. Unmanaged index returns assume reinvestment of any and all distributions and do not reflect our fees or expenses. Past performance may not be indicative of future results. Investing in securities involves risks, including the potential for loss of principal. There is no guarantee that any investment plan or strategy will be successful.
- The S&P 500 is a capitalization-weighted index designed to measure performance of the broad domestic economy through changes in the aggregate market value of 500 stocks representing all major industries.
- Nasdaq Composite Index includes all domestic and international common type stocks listed on the Nasdaq Stock Market.
- The S&P 500 Equal Weight Index (EWI) is the equal-weight version of the widely-used S&P 500. The index includes the same constituents as the capitalization weighted S&P 500, but each company in the S&P 500 EWI is allocated a fixed weight – or 0.2% of the index total at each quarterly rebalance.
- Russell 2000 consists of the 2,000 smallest U.S. companies in the Russell 3000 index.
- MSCI EAFE is an equity index which captures large and mid-cap representation across Developed Markets countries around the world, excluding the U.S. and Canada. The index covers approximately 85% of the free float-adjusted market capitalization in each country.
- MSCI Emerging Markets captures large and mid-cap representation across Emerging Markets countries. The index covers approximately 85% of the free-float adjusted market capitalization in each country.
- Bloomberg U.S. Aggregate Index covers the U.S. investment grade fixed rate bond market, with index components for government and corporate securities, mortgage pass-through securities, and asset-backed securities.
- Bloomberg U.S. Corporate High Yield Index covers the universe of fixed rate, non-investment grade debt. Eurobonds and debt issues from countries designated as emerging markets (sovereign rating of Baa1/BBB+/BBB+ and below using the middle of Moody’s, S&P, and Fitch) are excluded, but Canadian and global bonds (SEC registered) of issuers in non-EMG countries are included.
- FTSE NAREIT Equity REITs Index contains all Equity REITs not designed as Timber REITs or Infrastructure REITs.
- Bloomberg Commodity Index is calculated on an excess return basis and reflects commodity futures price movements. The index rebalances annually weighted 2/3 by trading volume and 1/3 by world production and weight-caps are applied at the commodity, sector and group level for diversification.
Material Risks
- Fixed Income securities are subject to interest rate risks, the risk of default and liquidity risk. U.S. investors exposed to non-U.S. fixed income may also be subject to currency risk and fluctuations.
- Cash may be subject to the loss of principal and over longer periods of time may lose purchasing power due to inflation.
- Domestic Equity can be volatile. The rise or fall in prices take place for a number of reasons including, but not limited to changes to underlying company conditions, sector or industry factors, or other macro events. These may happen quickly and unpredictably.
- International Equity can be volatile. The rise or fall in prices take place for a number of reasons including, but not limited to changes to underlying company conditions, sector or industry impacts, or other macro events. These may happen quickly and unpredictably. International equity allocations may also be impact by currency and/or country specific risks which may result in lower liquidity in some markets.
- Real Assets can be volatile and may include asset segments that may have greater volatility than investment in traditional equity securities. Such volatility could be influenced by a myriad of factors including, but not limited to overall market volatility, changes in interest rates, political and regulatory developments, or other exogenous events like weather or natural disaster.
- Private Real Estate involves higher risk and is suitable only for sophisticated investors. Real estate assets can be volatile and may include unique risks to the asset class like leverage and/or industry, sector or geographical concentration. Declines in real estate value may take place for a number of reasons including, but are not limited to economic conditions, change in condition of the underlying property or defaults by the borrow.
