
Trever Christian and John Schwalbach, Partners
June 14, 2024
Share This:
A back-to-the-basics look at allocating capital efficiently
Key Observations
- A fixation on the direction of interest rates continues to drive prices in the short term, including in May. Rates moved lower, pushing rate-sensitive asset classes ahead of their peers.
- However, we take this opportunity to step back from the short-term focus on rates and discuss the findings of our latest long-term study on the efficient allocation of active and passive investing.
- Notably, 92% of 10-year top-quartile managers spent at least one 3-year period in the bottom half of their peer group, highlighting that success is not linear. We have also added nuance to our review of efficient allocation in markets most likely and profitable to engage in active investing.
Market Recap
Rates, rates, and more rates. Perhaps an over-stylized narrative, but the market is clearly fixated on the direction of rates and the potential for a Fed rate cut. In May, rates moved lower, and there was a modest shift in Fed policy with a slowing of Quantitative Tightening, while maintaining the policy rate. As a result, more rate-sensitive sectors gained ground for the month, with longer-duration bonds outperforming cash, small caps in line with large caps, and REITs shining among real assets.
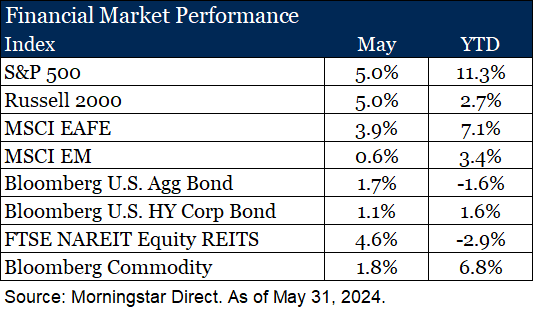
Despite these shifts, the S&P 500 managed to post a new high during the month, driven by continued exuberance around a few choice names that benefit from the intense focus on Artificial Intelligence. Despite the price increase, Q1 earnings season was favorable, leaving valuations relatively flat month-over-month at around 20x forward earnings. This remains at the upper end of the 20-year range, excluding the extraordinary spike seen around COVID due to the nuances of live prices and dated earnings. With 98% of companies reporting earnings, 78% have surprised to the upside, and earnings grew at a blended rate of 5.9%1.
Revisit The Basics – Active & Passive
Since 2007, we have delved into the data behind active and passive investing, always in pursuit of efficient portfolio allocations. While this is not a new debate, the discussion has often turned dogmatic over the years. Some believe that passive investing is the only efficient approach, while others argue that active investing offers unique opportunities, leaving little room for middle ground. However, intellectual honesty allows us to consider both perspectives simultaneously.
Our latest study embraces this nuanced approach to allocation, reaffirming that pragmatism and patience are the keys to success. Let’s begin with patience. After all, it is indeed a virtue. With respect to the selection of active managers, “top quartile” performance is often the goal. Our most recent study, along with the seven preceding it, continue to confirm that the path to success is not linear. Often, top-quartile managers face adversity along the way. Our latest 10-year review shows that 92% of top quartile managers over a ten-year period experience at least one three-year period where their results fall into the bottom half of their peer group. This trend has remained consistent over time, with figures ranging from the low 80s to our most recent study that concludes the number is now in the low 90s.
As the table illustrates, the cyclical path to success is not unique to any particular investment style, geography, or asset class. If you take away one thing from this paper, let it be the importance of patience. Without it, we risk falling prey to the trap of selling low and buying high—a true capital-destroying quagmire.
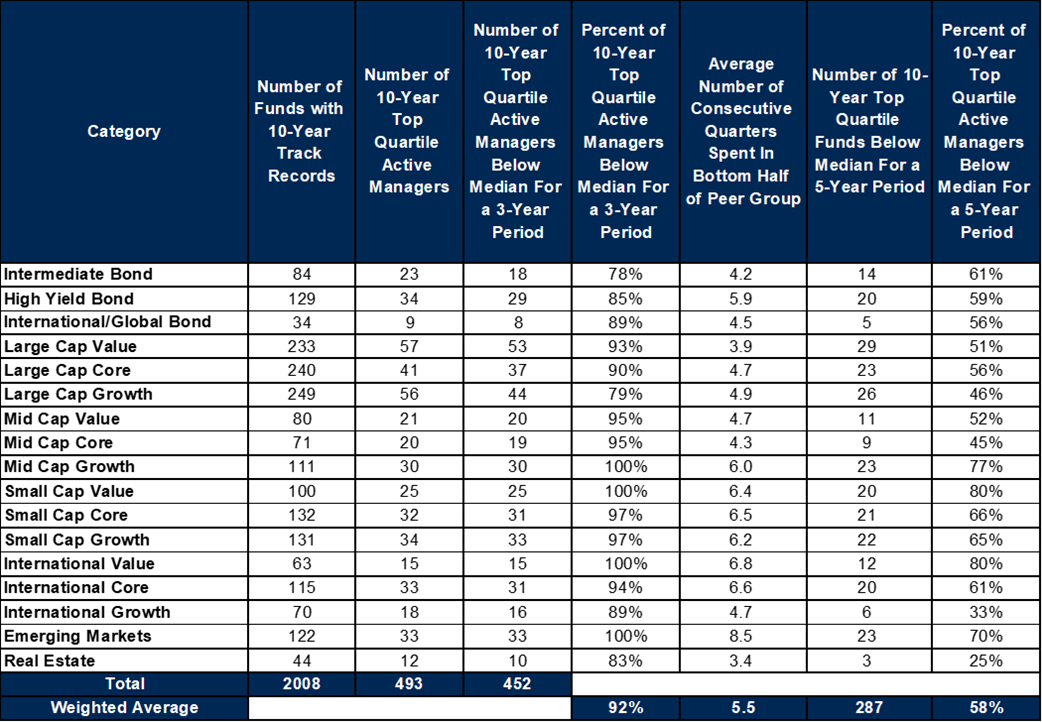
Source: Morningstar, Fiducient Analysis, December 31, 2023
Now, let’s talk pragmatism. Cognitive dissonance refers to the mental discomfort that comes from holding two seemingly conflicting beliefs at once. Yet in this discomfort, at least in this instance, underlies the opportunity in our opinion.
Our most recent study underwent enhancements to add context to this discussion. Below, we graphically and mathematically illustrate a simple concept. The x-axis represents the likelihood of outperforming the index—the higher the rank of the index, the lower the probability of selecting a manager who beats it. The y-axis represents the payoff, or lack thereof, in selecting a top-quartile manager.
To bring these ideas together, we like to use the analogy of a dartboard. The x-axis is the size of the dartboard: if we close our eyes and throw a dart, the larger the dartboard, the higher the probability of hitting it. The y-axis is the payoff for hitting the bullseye: if the payoff is low, we’re unlikely to invest time and energy in practicing and playing. If the payoff is high, it’s worth the effort.
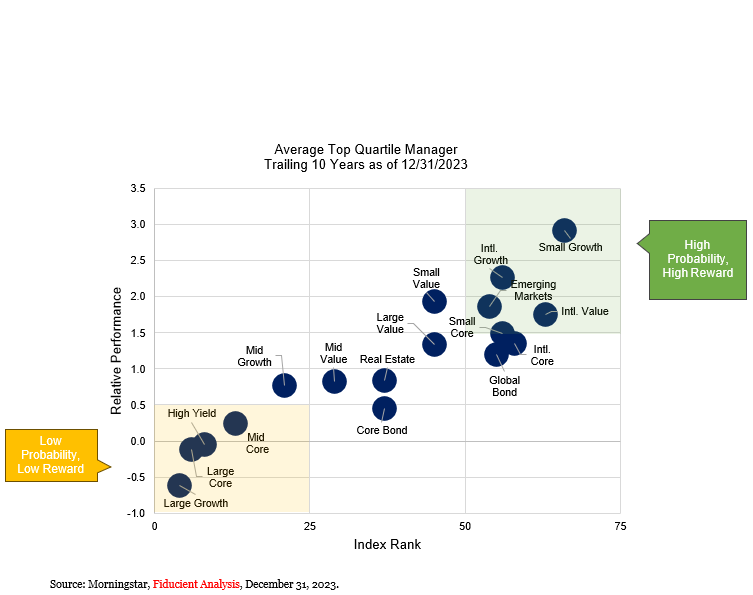
In our view, investors are most efficient with their capital by allocating actively in asset classes in the upper right quadrant of this graphic, rather than the bottom left. Is it perfect? No. As noted earlier, the truth often lies in shades of gray. For example, the high-yield fixed income index (bottom left) is effectively non-investable, and passive equivalents rarely match the index’s return, making the case for active. There are other examples where additional thought is required. That said, absent other information, following this rubric leads to a higher likelihood and magnitude of success.
Our team of experts is happy to hear from you if we can help at all.
1Factset Earnings Insight, May 31, 2024.
